April’s here and you’re already staring down Q1 data, exhausted before you even begin.
I understand the drama: too many posts, too many KPIs and too little time.
I know you know counting interactions like they’re trading cards just won’t cut it.
I know you know that we need judgment, structure and strategy.
I know you know that AI can help you, but you're not going to start playing with ChatGPT now.
So I've advanced the work for you.
From this little analytics bunker, I'm throwing you 3 prompts so you can customize them to your liking, depending on:
- the characteristics of your brand
- your target audience
- your analysis goal
And yes, I’ve included some output examples to help lower your cortisol, I know you’ve got a thousand things going on, and you need to see exactly what you're getting into before diving in. I feel you, really, I do. 💆
These prompts were created using Welov.io’s custom prompt generator (a real gem, if you ask me). The AI responds based on a sample of skincare brand content, and for this hypothetical example, I stepped into the shoes of a Eucerin Social Media Manager aiming to strengthen the brand’s positioning in sustainability within the hydration territory. A perfect simulation to show how the results could apply to a real-world case.
Let's do it! 🤓
I’ve teed up the prompts for you. Copy, paste, and pretend Q1 isn’t still haunting you.
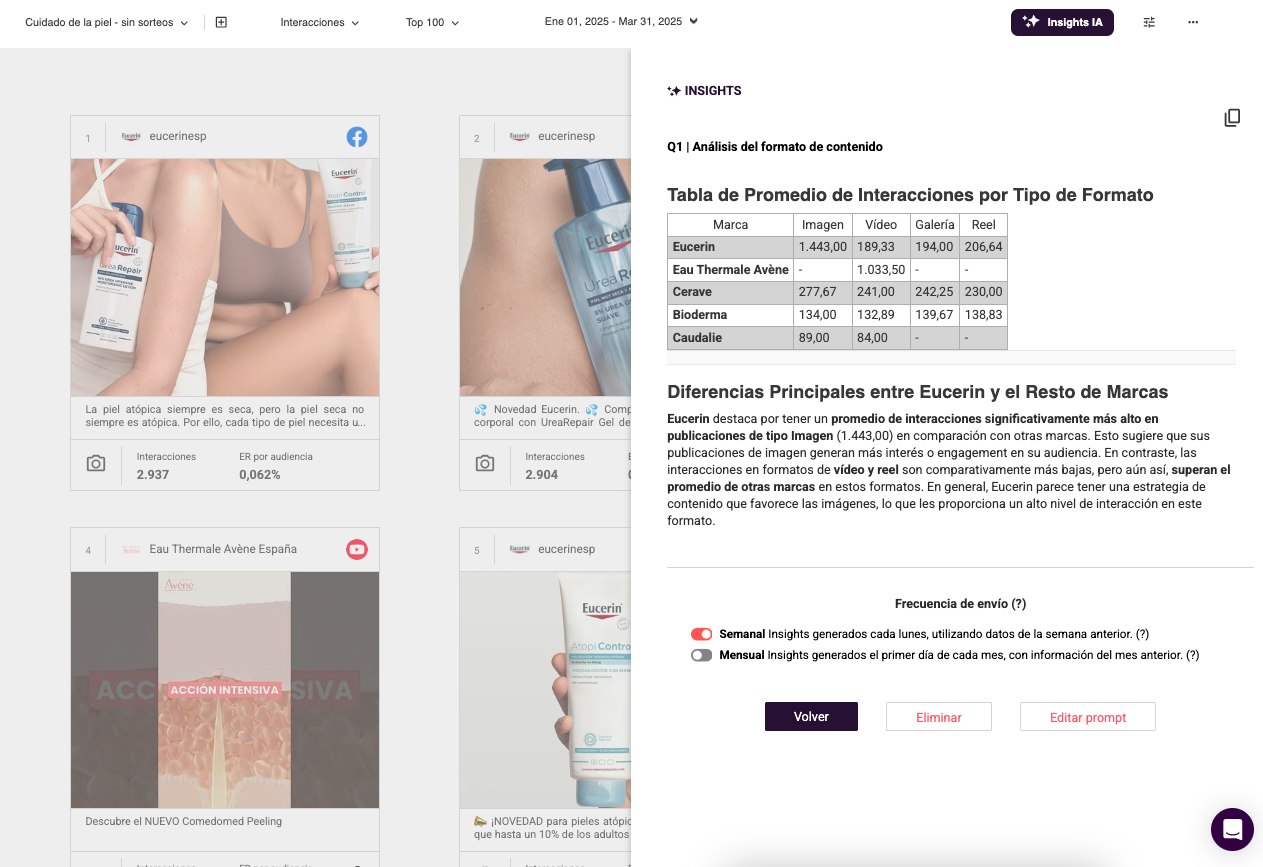
#PROMPT 1 | FORMAT ANALYSIS
Group all posts by format type (reel, carousel, image, video, etc.) and calculates the average number of interactions by type.
Create a table with one row per brand and one column per format type to show the average number of interactions per type.
Generate a short summary answering the question: what are the key differences between <YOUR BRAND> and the others?
Example of result
#PROMPT 2 | CONTENT TERRITORIES
Classify each post according to the content territory it covers, using the copy. Calculate the average number of interactions per topic and show the results in a table.
Answer the question: what narrative approach does it predominate in top-performing publications?
Create a short summary by brand, analyzing the content territories covered and how it does so (with what tone, CTA, positioning...)
Finally, answer the question: if <YOUR BRAND> wanted to position itself as <POSITIONING> , what recommendations would you make, and what content should it draw inspiration from?
Example of result
.gif)
No manual sorting? Yes please.
In a table? YES, I NEED THAT.
#PROMPT 3 | RECOMMENDATIONS FOR Q2
Heads up! This one goes deep.
You’re an expert in analyzing social media content from a strategic perspective. Based on the posts you need to review, answer the following questions briefly, using clear H1 headings and concise paragraphs — ready to export into a presentation for your supervisors.
You’re working as the Social Media Manager for <YOUR BRAND>, and your challenge is to position the brand as <POSITIONING>, targeting <YOUR AUDIENCE>.
1) What content from <YOUR BRAND> aligns with this strategic approach?
2) What are other brands doing around this positioning? What can be learned from their top-performing content to better reach <YOUR AUDIENCE>? Present your findings in a table.
3) What content would you recommend for <YOUR BRAND> to support this positioning and reach <YOUR AUDIENCE>?
4) List 5 social media actions to roll out next quarter. Present them in a table with action name, brief convincing explanation and example post.
Example of result
.gif)
✨ BONUS TRACK ✨
Giveaway and contests
Exclude this type of content when running prompts focused on top-performing posts, it can distort strategic conclusions.
Key dates in the quarter
Ask for recommendations on content or actions tied to specific dates, like Mother’s Day or other important moments for your brand in Q2.
Organize the information
Request the outputs in the format and tone you typically use (informal, table-based, executive, friendly - whatever fits your style).
And hey, don’t be stingy. If this helped you, share it. Knowledge sharing doesn’t lower your ER.