When we talk about social media metrics, the focus is usually on the now: how many likes did that post get? how did last week's campaign perform? what's our current follower count? It make sene, real-time numbers feel urgent. But if you're onbly tracking the present, you're missing the bigger picture. And that means missing opportunities.
This is where historical analysis becomes essential. It's not just about collecting numbers, it's about turning long-term data into strategic insights.
What do we mean by "historical analysis"?
It's the process of gathering, comparing, and interpreting your social media metrics over time, whether that's weeks, months, quarters or years.
Done well, it helps you:
- spot patterns and trends
- understand how your audience behavior evolves
- get real context for your performance
- make smarter, data-driven decisions
In short: you look back to understand what's working now, and what's coming next.
Why one snapshot isn't enough?
Looking at metrics in isolation (likes, comments, reach) can be misleading. Maybe you're looking at a fluke, a campaign peak, or an algorithm bump.
Without the broader timeline, you risk building your next move on the wrong assumptions.
1) Context changes everything
Today’s metrics only have meaning when you compare them with what came before. Is that engagement rate actually good? Compared to what?
Let’s take a real example:
From January to April, we analyzed 8 hotel brands across three consecutive years (2023–2025). We looked at total posts, average interactions per post, and how many brands were active.
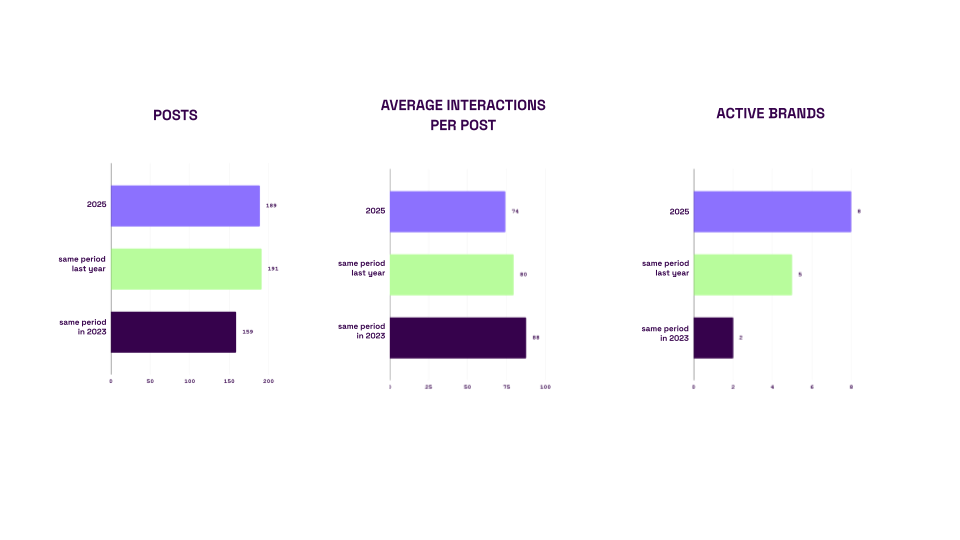
In 2025, these brands published 189 posts, with an average of 74 interactions per post. Not bad, right?
But here’s the thing: in 2024 there were 191 posts, not a huge difference. However, in 2025 there were more brands active, yet fewer interactions per post.
So, what’s going on?
It could mean:
- the 2025 content didn’t resonate as much
- the newly active brands in 2025 didn’t add strong value
- or maybe audience attention is shifting elsewhere
This kind of analysis brings nuance you’ll never get from surface-level stats.
2) Spotting trends and seasonality
Looking at your historical data also helps you identify repeat patterns, things like:
- seasonal dips and peaks
- campaign cycles
- changes caused by algorithm updates
Here’s another example:
In a two-year Black Friday analysis, we saw that brands consistently started posting about Black Friday about three weeks in advance.
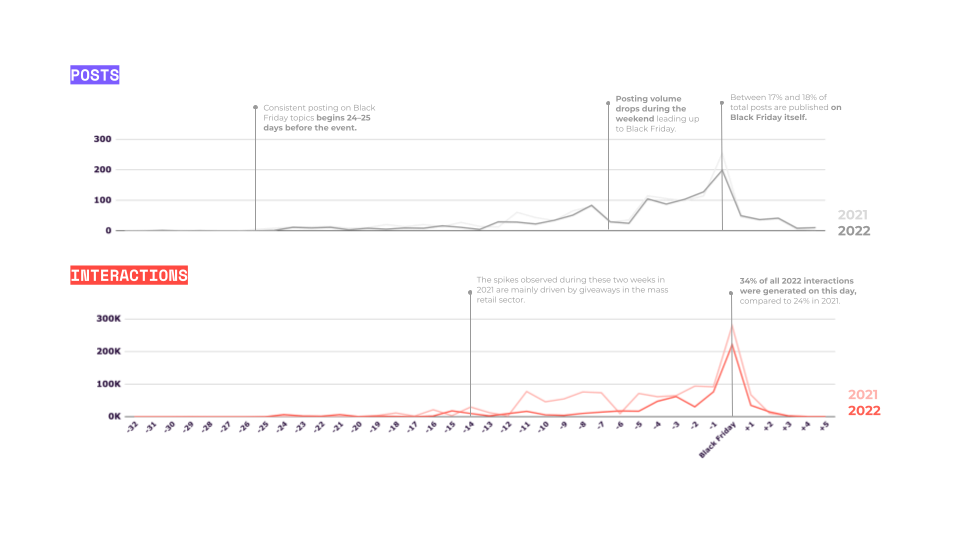
Posting volume didn’t change much. But when we zoomed in on interactions, we noticed clear peaks in one of the years.
Digging deeper, we found that these spikes were tied to giveaways, concentrated in one industry. If we hadn’t compared year-over-year, those peaks could’ve easily been misread.
3) Measuring campaign impact over time
Evaluating a campaign only by its short-term performance is a trap. What matters is how it shifts the long-term behavior of your audience.
Let’s look at a real case with Sephora’s Instagram in 2024.
We tracked:
- Monthly follower growth
- Interactions on giveaway-related posts
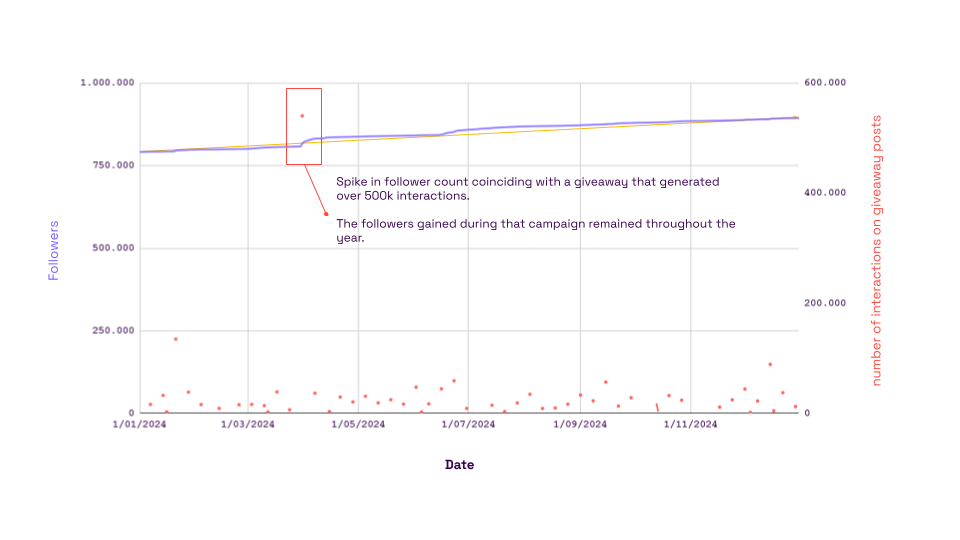
Around March 31st, there’s a clear spike, tied to a giveaway that required following the account. But what’s interesting is what happened after: despite assumptions that giveaway followers are “just passing through,” Sephora kept growing consistently month after month.
The takeaway: when you analyze over time, you see what really sticks.
Why historical analysis should be part of your strategy
Historical analysis isn’t just a “nice to have.” It’s a strategic necessity.
It helps you:
- understand what’s driving performance
- identify areas for optimization
- avoid overreacting to anomalies
- make confident, evidence-based decisions
It also stops you from misinterpreting your data in isolation and gives you a clearer view of how your audience interacts with your content over time.
If you're feeling unsure about your current results or struggling to justify them to clients or leadership, this is the kind of analysis that changes the conversation.
How do actually do it (without burning out)
Trying to do all this manually? Big mistake.
You’ll run into:
- inconsistencies in data collection
- missed context
- high chance of human error
- wasted time
To do this right (and fast), you need specialized tools that ensure clean data capture, long-term storage, and usable visualizations. And more importantly: you want AI involved.
AI can detect patterns humans miss. It can flag correlations between metrics, surface audience behavior shifts, and speed up decision-making.
Your quick-start checklist for historical social media analysis
- Select the social profiles you want to analyze
Start by identifying which accounts you want to track across time. Make sure the tool you’re using has access to enough historical data, either through direct integration or your internal database. Here's the available data history if you connect via Welov.io.
- Choose your key metrics
Pick the indicators most relevant to your analysis goals: posts, follower count, engagement, formats, etc.
- Define your time frame
Decide the period you want to compare, whether it’s months, quarters, or full years, so you can track how your metrics have evolved.
- Build comparison visuals
Use charts and graphs to compare different time windows (for example, Q1 2024 vs. Q1 2025) and spot variations at a glance.
- Identify patterns and anomalies
Look for seasonal trends, campaign impact, or sudden drops and spikes in interaction. This is where AI can help. If you're curious how we handle it at Welov.io, you can check it out there
- Extract strategic insights
Connect changes in your metrics to specific actions (like giveaways, launches, changes in posting frequency) and evaluate their long-term impact.
- Export and share your report
Download your results in a clear, visual format, ready to present to your team or clients, backed by historical data and easy-to-read insights.